
Digital Radiography as a diagnostic tool in dentistryPaul F. van der Stelt, DDS, Phd
Dept. of Oral and Maxillofacial Radiology Academic Center for Dentistry Amsterdam Amsterdam, the Netherlands From the Summer 2004 AADMRT Newsletter  Paul F. van der Stelt, DDS Paul F. van der Stelt, DDS
Digital radiography is currently being used by an increasing number of dental professionals. It is considered to be a well established technology. Numerous scientific studies have been published showing that the diagnostic performance of direct systems (CCD, CMOS) as well as indirect systems (Storage Phosphor Plate based) is equal to, or even better than that of traditional film based imaging. The digital systems are not an experimental technology any more, but could very well replace film to produce images in dental radiology.
The introduction of digital radiology in dentistry was not until about 25 year ago, while analog film has already been in use for more than 100 years. Many dentists have never used digital systems on a routine base during their professional training. These factors may contribute to the fact that dentists sometimes feel insecure when they have to take decisions about the conversion to digital and which system will best meet their requirements. The questions dentists ask themselves and subsequently their advisors, when they are exploring the possibilities of digital radiography, are most frequently focused on the choice of hardware. Manufacturers often emphasize the large reduction of dose to the patient compared to film based radiography. This seems to suggest that digital radiography is just an electronic replacement of traditional film based imaging. It certainly does not reflect the fact that digital radiographic images have a much more important advantage over film based radiographs; it is possible to optimize the appearance of the image after the exposure has taken place. |


|
A conventional radiograph cannot be altered when it has been taken, although the viewing conditions will have some influence on how well the information can be seen. A digital image, on the other hand, can be used as input for a computer program to improve the accessibility of diagnostic information from the radiographic image.
In this article a few examples will be given of methods to improve the diagnostic value of digital radiographs, advantages that are not found in film based imaging. You should be aware that image processing can never add information to the image; it can only make the information more accessible to the user, i.e. the clinician.
The Basics of Image Processing
A digital image consists of a large number of pixels (picture elements), which are arranged in an orderly array of columns and rows. Each pixel is described by three values: the x-coordinate and the y-coordinate which determine the location of the pixel in the image, and a value indicating the shade of gray of that pixel, which in its turn is related to the amount of radiation detected by the sensor at that particular pixel location. The total collection of pixels which form the radiographic image are stored in the computer as numbers. The computer then can be used to apply special mathematical operations on these numbers and the outcome is used to display the processed image on the screen again.
Contrast and Density Correction
In order to distinguish details in a radiographic image, the contrast has to be good. In general, the exposure settings should be such that the full dynamic range of possible gray values is shown. Only after the exposure has been made will it become clear if one has been successful in achieving this. Sometimes, it turns out that the radiograph has been over- or underexposed to an extent where it is no longer of diagnostic value. This was a reason for a retake when film was used to produce the radiograph. This is different, however, for digital imaging; the range of gray levels of a digital image can be corrected using computer software, and an over- or underexposed image can be changed into an image showing the full range of gray values.
When an image is under- or overexposed, the gray values do not fill the full range of possible gray values. They are compressed into a smaller part of the full range (figure 1). It means that gray values of a particular structure are closer together than usual, which will be perceived as a lack of contrast. By moving the gray values further apart the contrast is increased and the image features can be perceived more easily by the human visual system. Again, no information is added, but the existing information is made available to the clinician more effectively.
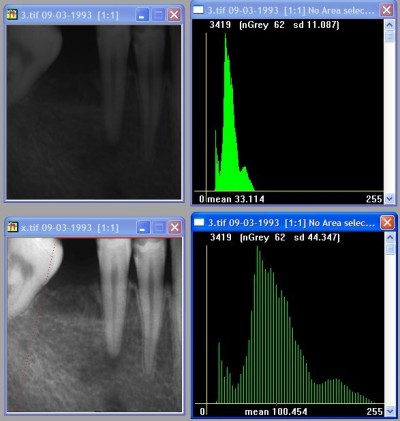
Figure 1: Overexposed image and its histogram of gray values with gray values occupying only part of the full scale (top); same image after contrast stretching and its histogram when gray values are arranged over the full scale (bottom).
Contrast and density optimization can also be used to optimize the image for specific diagnostic tasks. For instance, for caries diagnosis a higher contrast is better. For the assessment of periodontal bone defects a somewhat lower contrast is required. A single digital image can be adjusted for these and other diagnostic tasks without taking additional exposures.
Correction of density and contrast can be done interactively by the user. There is a chance, however, that one keeps changing contrast and brightness until the image seems to show the lesion one expected to see. This approach is therefore somewhat subjective and not reproducible.
Standardization
It is better to use the capabilities of computer software to optimize the contrast and density. One possibility is to stretch the gray values equally over the full range of possible gray values (see also figure 1). This can be accomplished in a standardized way by computer software.
Another option is to match the gray value distribution of a wrongly exposed image to the distribution of a correct image of the same patient and the same region. This is also built into some software programs for digital dental radiography. These two approaches make sure that the result is standardized and reproducible. When one wants to do the same operation again later, the result will be exactly the same.
Measurements
The location of each individual pixel in a digital image is described exactly by its x- and y-coordinates. Because of the numerical character of this information it is straightforward to perform measurements. These measurements can include lengths or area measurements, but also measurements of angles between two lines.
The measurement of the length of a root canal is conveniently done by taking a radiograph of an endodontic file of known length inserted into the root canal. The beginning and end of the file and the location of the root tip are indicated in the radiographic image. The computer can then easily calculate the magnification of the image from the measured length of the file and subsequently the real length of the root. This is something that can be done on a conventional image as well, but it requires only a few mouse clicks when a digital image is available (figure 2).
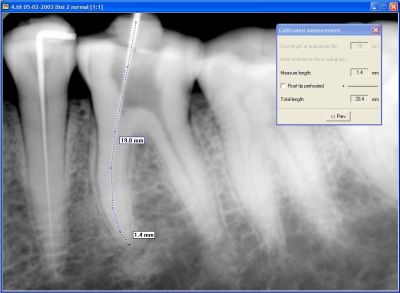
Figure 2: Measurement of the length of a root canal using an endodontic file to calibrate the magnification factor.
Quality Control
Digital images also make it possible to apply quality control of exposure conditions very easily. For instance, you can display the gray level distribution of an image in a graphical representation in which the gray scale is shown on the x-axis and the frequency of each gray value along the y-axis. When the exposure time was too low when the image was taken, the histogram will be empty at the left side of the histogram. For an overexposed image, the opposite happens: the histogram will move to the left and a certain range of gray values at the right side will be empty. The histogram offers thus a quick and complete overview of the correctness of the exposure settings.
Subtraction
Subtraction radiography was first introduced by B. Ziedses des Plantes in 1935. He used film based images of course, but today subtraction radiography has become much more feasible by using digital images.
In subtraction radiography two images are taken with a certain period of time in between. The first image shows the base line. The second image shows what has changed since then. This could be the result of a treatment or the effect of an ongoing pathologic process. Subtraction consists of subtracting the pixel values of the base line image from the pixel values of the second image. When nothing has happened, the result is zero. When bone loss or bone gain has occurred in the meantime, the result will be different from zero. When there is bone gain (less radiolucent, lighter area in the image, higher pixel gray value in the second image) the outcome will be a value above zero. In case of bone loss, the result is the opposite and a value below zero will be the outcome. Because negative values cannot be displayed on the screen, usually an offset of 127 is added to the outcome of the subtraction process. The screen shows a neutral gray in places where nothing has happened. It is darker where material has disappeared and brighter where the amount of tissue or material has increased (figure 3).
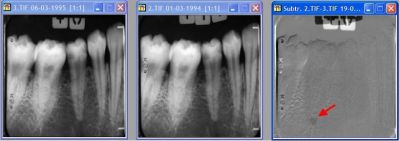
Figure 3: Subtraction radiography. The image to the right is the result of the subtraction of the second image from the first image. Note the dark area indicating bone loss (red arrow) that was not visible on the original image.
Subtraction radiography is a very sensitive method, because it cancels out the anatomical noise. Anatomical noise are the structures that are in the image, but are not influenced by the pathology that has to be detected. The irregular trabecular pattern, for instance, will influence the detectability of bone lesions.
Reconstruction
In order to obtain images that are suitable for subtraction radiography, the two images have to be identical with respect to gray value density distribution and certainly should have the same projection geometry. If one image is taken from a different direction, the subtraction image does not show the pathology but merely the difference due to the different projection directions.
Software is now available to convert the projection geometry of one image into that of the other, thus making subtraction radiography possible, without taking rigid and cumbersome measures to obtain a perfect line up of patient, x-ray machine and sensor system (figure 4). Because of the availability of this software, subtraction radiography is now within reach of every general practitioner and clinician who wants to perform advanced diagnosis of periodontal and other bony lesions.
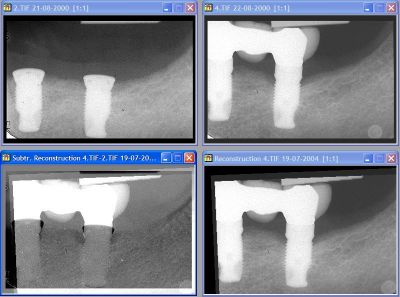
Figure 4: Subtraction radiography after geometric reconstruction of the second image (top right original, bottom right reconstructed) to match images that where taken from slightly different directions. Subtraction is now possible (bottom left).
Image Processing and Legal Implications
Because of the possibilities of image processing, it is often postulated that digital images cannot be used as evidence in a situation where there is a dispute about certain aspects of dental treatment. For an image isolated from the patient database this could be true, but otherwise it is not true. First of all, the computer system keeps track of the creation date of image files and the last date when it has been changed.
The image is also part of a database, where access to the image from outside the database is usually rather complicated. Furthermore, it requires a lot of skills to manipulate an image in such a way that the experts cannot find the transition between pixels belonging to the original image, and pixels that have been manipulated.
A state-of-the-art image database, therefore, should also log who has been accessing the image and when this happened. It goes without saying, that always the original image has to be archived. When an image has been adjusted in terms of brightness and density for instance, still the original image will be in the database, and when the image is retrieved again, the same adjustments will be applied automatically to the displayed image.
Archiving and Retrieval
An aspect that is still too often overlooked, is the integration of different sensor systems into one environment. Sensor systems are offered with their own software to acquire, process and archive images. However, software from one manufacturer is not suitable to control sensor systems from other manufacturers. Only a few software packages are now on the market that are specially designed to be used in an environment where sensor systems from different manufacturers are used.
Having one integrated software environment has many advantages: users have to be acquainted with only one software interface; all images are stored in a single database; images obtained according to different imaging modalities (intra-oral and panoramic for instance) are shown on one screen; when a sensor system is replaced, the images that are already archived in the database, are still accessible in the same way as the new images; a new sensor system does not require the users to become familiar with new software.
This is an aspect that has to be taken into account in larger clinics, where intra-oral and extra-oral equipment are not by definition from the same vendor. It is certainly an aspect in a clinic where advanced image modalities are used such as CT and tomography. It will also become important for the general practitioner who wants to replace his current sensor, or wants to increase the capabilities by buying another sensor system, which is not necessarily from the same manufacturer.
Conclusion
The description of a number of available image processing tools, given in this article, will make it clear how versatile digital x-ray images can be, and suggest the potential for their use as a diagnostic tool in the clinical environment. A free demo version of a software package for digital radiology in dentistry can be downloaded from www.radiology.acta.nl (go to "image processing" then to "download").